1 of 9 in Series: The Essentials of Excel 2010 Pivot Tables and Pivot Charts
A pivot table is a special type of summary table that's unique to Excel. Pivot tables are great for summarizing values in a table because they do their magic without making you create formulas to perform the calculations. Pivot tables also let you play around with the arrangement of the summarized data. It's this capability of changing the arrangement of the summarized data on the fly simply by rotating row and column headings that gives the pivot table its name.Follow these steps to create a pivot table:
- Open the worksheet that contains the table you want summarized by pivot table and select any cell in the table.Ensure that the table has no blank rows or columns and that each column has a header.
- If necessary, adjust the range in the Table/Range text box under the Select a Table or Range option button.If the data source for your pivot table is an external database table created with a separate program, such as Access, click the Use an External Data Source option button, click the Choose Connection button, and then click the name of the connection in the Existing Connections dialog box.
- Select the location for the pivot table.By default, Excel builds the pivot table on a new worksheet it adds to the workbook. If you want the pivot table to appear on the same worksheet, click the Existing Worksheet option button and then indicate the location of the first cell of the new table in the Location text box.
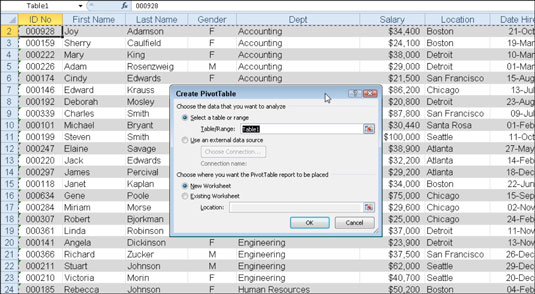 Indicate the data source and pivot table location in the Create PivotTable dialog box.
 - Click OK.Excel adds a blank grid for the new pivot table and displays a PivotTable Field List task pane on the right side of the worksheet area. The PivotTable Field List task pane is divided into two areas: the Choose Fields to Add to Report list box with the names of all the fields in the source data for the pivot table and an area divided into four drop zones (Report Filter, Column Labels, Row Labels, and Values) at the bottom.
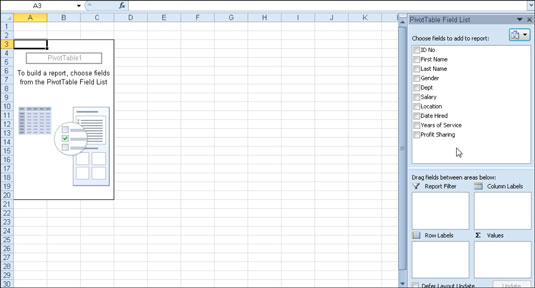 New pivot table displaying the blank table grid and the PivotTable Field List task pane.
 - To complete the pivot table, assign the fields in the PivotTable Field List task pane to the various parts of the table. You do this by dragging a field name from the Choose Fields to Add to Report list box and dropping it in one of the four areas below, called drop zones:
- Report Filter: This area contains the fields that enable you to page through the data summaries shown in the actual pivot table by filtering out sets of data — they act as the filters for the report. So, for example, if you designate the Year Field from a table as a Report Filter, you can display data summaries in the pivot table for individual years or for all years represented in the table.
- Column Labels: This area contains the fields that determine the arrangement of data shown in the columns of the pivot table.
- Row Labels: This area contains the fields that determine the arrangement of data shown in the rows of the pivot table.
- Values: This area contains the fields that determine which data are presented in the cells of the pivot table — they are the values that are summarized in its last column (totaled by default).
- Continue to manipulate the pivot table as needed until the desired results appear.
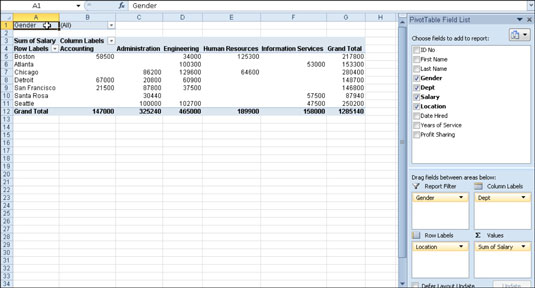 Completed pivot table after adding the fields from the employee table to the various drop zones.
As soon as you create a new pivot table (or select the cell of an existing table in a worksheet), Excel displays the Options tab of the PivotTable Tools contextual tab. Among the many groups on this tab, you find the Show/Hide group that contains the following useful command buttons:
- Field List to hide and redisplay the PivotTable Field List task pane on the right side of the Worksheet area.
- +/- Buttons to hide and redisplay the expand (+) and collapse (-) buttons in front of particular Column Fields or Row Fields that enable you to temporarily remove and then redisplay their particular summarized values in the pivot table.
- Field Headers to hide and redisplay the fields assigned to the Column Labels and Row Labels in the pivot table.
PivotGrid control for pivot table creation
ReplyDelete